

Why R Feels Intimidating—and Why It Shouldn’t
For many beginners, the idea of learning a programming language for statistical analysis can feel overwhelming. This is especially true in fields like health research, social sciences, and biology, where professionals often come from non-programming backgrounds. The first encounter with a command-line interface, unfamiliar syntax, and abstract concepts can create a psychological barrier that discourages further exploration.
R is one of those tools that initially appears complex but becomes incredibly powerful and intuitive once you push past the early discomfort. The fear surrounding R is not really about the language itself—it’s about uncertainty, unfamiliarity, and the assumption that programming is inherently difficult. In reality, R is designed to make data analysis more flexible, transparent, and reproducible than traditional point-and-click software.
This article is not just an introduction to R—it is a complete, in-depth exploration meant to replace hesitation with confidence. If you approach it correctly, R can become one of the most valuable tools in your analytical toolkit.
Understanding R: More Than Just a Programming Language
R is a language specifically built for statistical computing and data analysis. Unlike general-purpose programming languages, R was designed with statisticians and researchers in mind. Its ecosystem includes thousands of packages that extend its functionality far beyond basic analysis.
At its core, R allows you to manipulate data, perform statistical tests, and create visualizations. But what truly sets it apart is its flexibility. Instead of being limited by predefined menus, you can customize every step of your analysis. This means you are not just using tools—you are building them.
Another defining feature of R is its ability to integrate code, results, and explanations into a single workflow. This makes your research more transparent and reproducible, which is essential in modern scientific practice.
The Real Advantages of Using R in Research and Data Analysis
One of the strongest arguments for learning R is its open-source nature. Unlike commercial statistical software, R is completely free. This removes financial barriers and ensures that anyone, regardless of resources, can access powerful analytical tools.
However, the benefits go far beyond cost. R promotes reproducibility, which is a cornerstone of credible research. Every step of your analysis can be documented and shared, allowing others to replicate your work or apply your methods to new datasets. This level of transparency is difficult to achieve with traditional software.
Another major advantage is adaptability. R runs on multiple operating systems and integrates with various data sources, from simple spreadsheets to complex databases. Whether you are working with small datasets or large-scale data, R can handle it.
The community surrounding R is another critical strength. There are thousands of contributors worldwide who continuously develop new packages, fix bugs, and provide support. When you encounter a problem—and you will—you are rarely the first person to face it. Solutions are often just a search away.
Overcoming the Initial Barrier: The Psychology of Learning R
The biggest obstacle for most beginners is not technical—it is mental. The command-line interface feels unfamiliar, and error messages can seem cryptic. But this is a normal part of the learning process.
Think of learning R like learning a new language. At first, every word feels foreign, and forming sentences is difficult. Over time, patterns emerge, and fluency develops naturally. The same applies to R. You do not need to understand everything at once. What matters is consistency and gradual progress.
Errors, in particular, should not be seen as failures. They are feedback. Each error message is an opportunity to understand how R interprets your commands. Instead of fearing mistakes, you should use them as learning tools.
Setting Up Your Environment: The First Practical Step
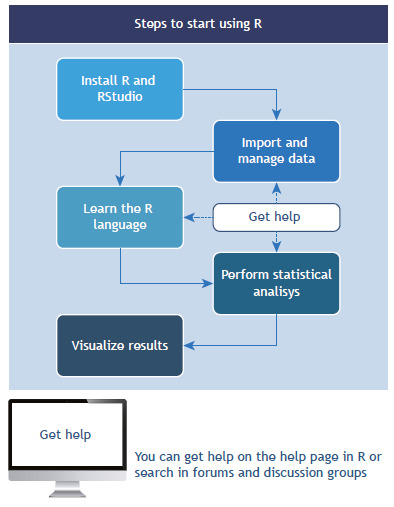
Before you can begin working with R, you need to set up your environment. This typically involves installing R itself and an integrated development environment such as RStudio.
RStudio provides a more user-friendly interface, combining a script editor, console, workspace viewer, and plotting area into a single layout. This makes it easier to organize your work and understand what is happening at each step.
Once installed, you are ready to start writing commands and exploring the language. This initial setup is straightforward, but it marks an important transition—from thinking about learning R to actually using it.
Working with Data: From Import to Transformation
Data is at the heart of any analysis, and R provides powerful tools for handling it. You can import data from various sources, including CSV files, Excel spreadsheets, and databases. Once imported, data is typically stored in structures such as data frames.
From there, you can clean and transform your data. This includes filtering rows, selecting variables, merging datasets, and creating new variables. These steps are often the most time-consuming part of any analysis, but R makes them highly efficient once you understand the basic functions.
Working with data in R also encourages a deeper understanding of your dataset. Instead of relying on automated processes, you actively shape and explore your data, which leads to more accurate and meaningful results.
Learning the Language: Building a Strong Foundation
To use R effectively, you need to learn its basic syntax and structure. Commands in R are essentially instructions that tell the program what to do. These can range from simple calculations to complex statistical models.
At first, it is enough to focus on fundamental concepts such as variables, functions, and data structures. You do not need to memorize everything. Instead, aim to understand how different components interact.
Practice is essential. Writing small scripts, experimenting with commands, and solving simple problems will gradually build your confidence. Over time, what once seemed complicated will become second nature.
Performing Statistical Analysis: From Simple to Advanced
One of R’s greatest strengths is its ability to perform a wide range of statistical analyses. Basic operations such as calculating means, medians, and standard deviations can be done with minimal effort. More advanced techniques, including regression models, survival analysis, and hypothesis testing, are also readily available.
R’s package system allows you to extend its capabilities even further. Specialized packages are designed for specific types of analysis, enabling you to apply advanced methods without having to build everything from scratch.
The key is to start simple. Master basic analyses before moving on to more complex techniques. This layered approach ensures that you build a solid foundation while gradually expanding your skills.
Data Visualization: Turning Numbers into Insight
Data visualization is not just about creating charts—it is about understanding and communicating your results. R excels in this area, offering powerful tools for generating high-quality graphics.
With the right approach, you can create visualizations that reveal patterns, highlight trends, and support your conclusions. These visuals are essential for both exploratory analysis and presenting your findings to others.
Learning to visualize data effectively takes time, but it is one of the most rewarding aspects of using R. A well-designed chart can convey insights that would be difficult to express through numbers alone.
Getting Help: You Are Not Alone
One of the most reassuring aspects of learning R is the availability of support. Every function in R includes built-in documentation that explains how it works and provides examples.
Beyond that, the global R community is an invaluable resource. Online forums, discussion groups, and tutorials offer solutions to common problems and guidance for more advanced topics. Engaging with the community not only helps you solve issues but also exposes you to new ideas and techniques.
The important thing is to ask questions and stay curious. No one learns R in isolation.
Building Confidence Through Practice
Confidence in R does not come from reading about it—it comes from using it. Start with small, manageable projects. Analyze simple datasets, replicate examples, and gradually increase the complexity of your work.
Each project you complete reinforces your understanding and reduces uncertainty. Over time, tasks that once seemed difficult will become routine.
Consistency matters more than intensity. Regular practice, even in short sessions, is far more effective than occasional deep dives.
From Fear to Mastery
Learning R may feel challenging at first, but that challenge is temporary. The initial discomfort is simply part of the process of acquiring a new skill. Once you move past it, you gain access to a powerful and flexible tool that can transform the way you approach data analysis.
The key is to stay patient and persistent. Do not aim for perfection—aim for progress. With each step, you will build confidence, deepen your understanding, and unlock new possibilities.
At some point, you will realize something important: the fear is gone. And in its place is a skill that will serve you for years to come.